How It Works
Functional tests are woven into the migration lifecycle — they are not a separate step you run after the fact. Here is how they fit in:1
Roadmap Generation
The roadmap is established, defining the ordered set of milestones for your migration.
2
Test Generation
Morph dispatches testing agents for each milestone. Backend testing agents explore the source code, run the application, and record expected behavior for APIs and CLIs. Frontend testing agents generate Playwright scripts that exercise specific user flows with deterministic assertions. User simulation agents freely browse the application and document key moments as screenshots and videos. This ensures tests capture production-realistic details — bootstrap sequences, authentication, headers, visual layout, and more.
3
Milestone Execution
During milestone execution, Morph agents run your migrated code and actively verify that functional tests pass as part of the implementation loop. Results appear in each milestone’s test summary and in the project-level Validation Hub.
4
Final Validation & Results
After execution completes, all tests are run against the PR branch. Results are reported in the UI so you can verify behavioral equivalence before merging.
What Makes These Tests Different
Supported Application Types
Morph functional testing covers four categories, grouped in the Validation Hub as API/CLI and UI Testing (itself split into Test and Comprehensive):The Validation Hub
The Validation Hub is the project-level dashboard accessible from the sidebar. It organizes all test and lifecycle results across three tabs: API/CLI for backend tests, UI Testing for frontend tests (scripted and agent-driven), and Lifecycle for the install/build/run/test scripts executed to stand up each application. Only tabs with results are shown.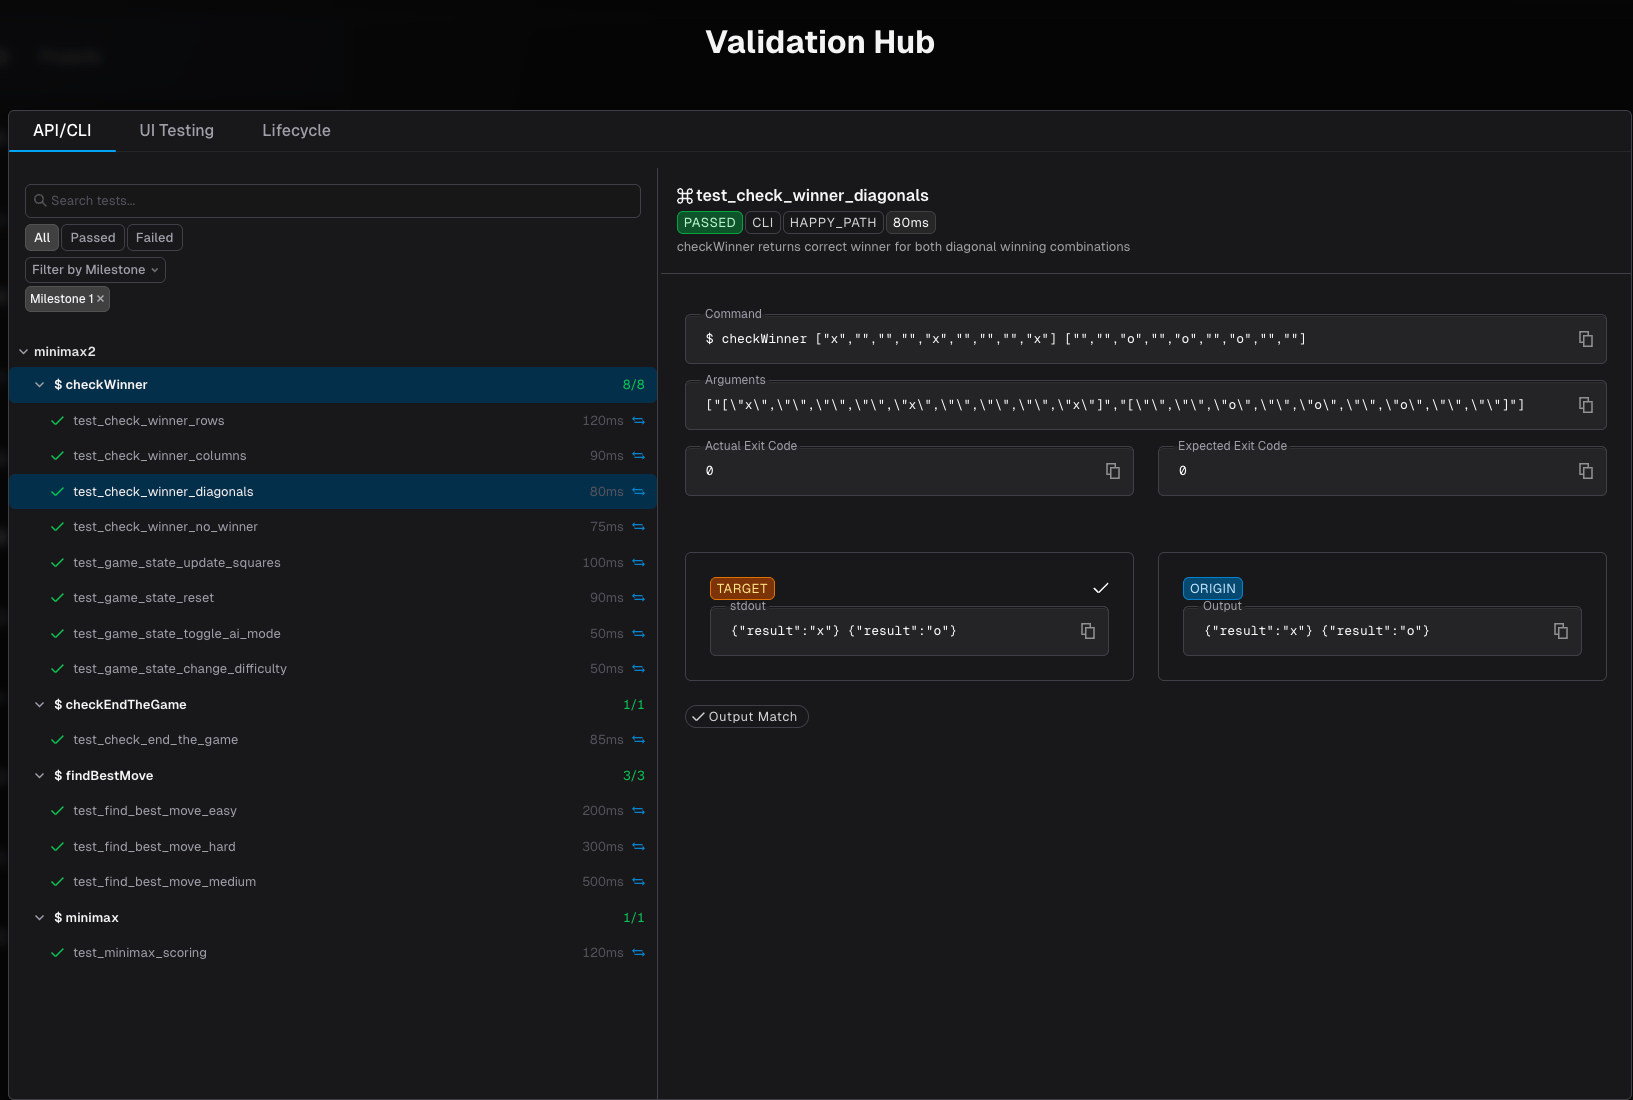
API/CLI Tab
The API/CLI tab shows backend functional test results — API endpoint responses and CLI command outputs compared between origin and target.Sidebar Tree
The left sidebar organizes tests in a hierarchy:- Repository — Each repo in the project is a collapsible group
- Entity — Within each repo, tests are grouped by entry point, with a passed/total count (e.g.,
8/8):- For APIs:
GET /health,POST /add, etc. - For CLIs:
$ checkWinner,$ findBestMove, etc.
- For APIs:
- Individual tests — Each test case under its entity, showing pass/fail status, duration, a comparison icon if origin data is available, and — for failed tests — an external-link icon that jumps to the linked review issue
Detail Panel
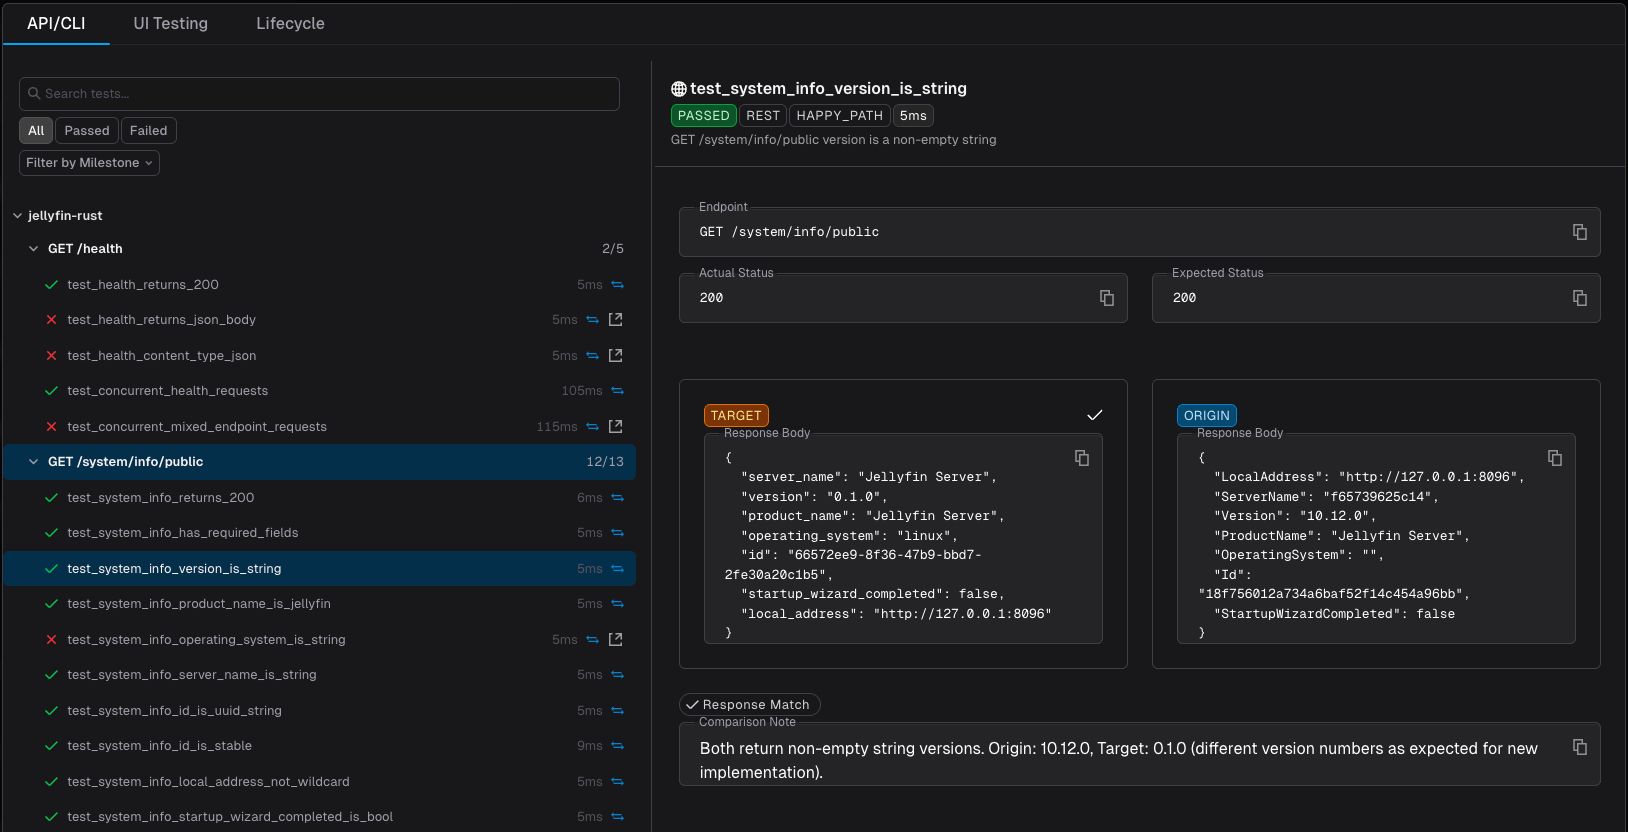
Selecting a test opens the detail panel on the right. The content adapts to the protocol type: For API tests:- Endpoint — HTTP method and path (e.g.,
GET /system/info/public) - Expected vs Actual Status — Status codes with mismatch highlighting
- Request Body — The payload sent to both origin and target
- Target Response — Status code and response body from the migrated application
- Origin Response — Response body from the original application (when comparison data is available)
- Match indicators — Response Match / Response Mismatch tags with an optional diff view
- Comparison Note — An agent-written note explaining the comparison result — useful when origin and target differ for an expected reason (e.g., a version bump) rather than a real regression
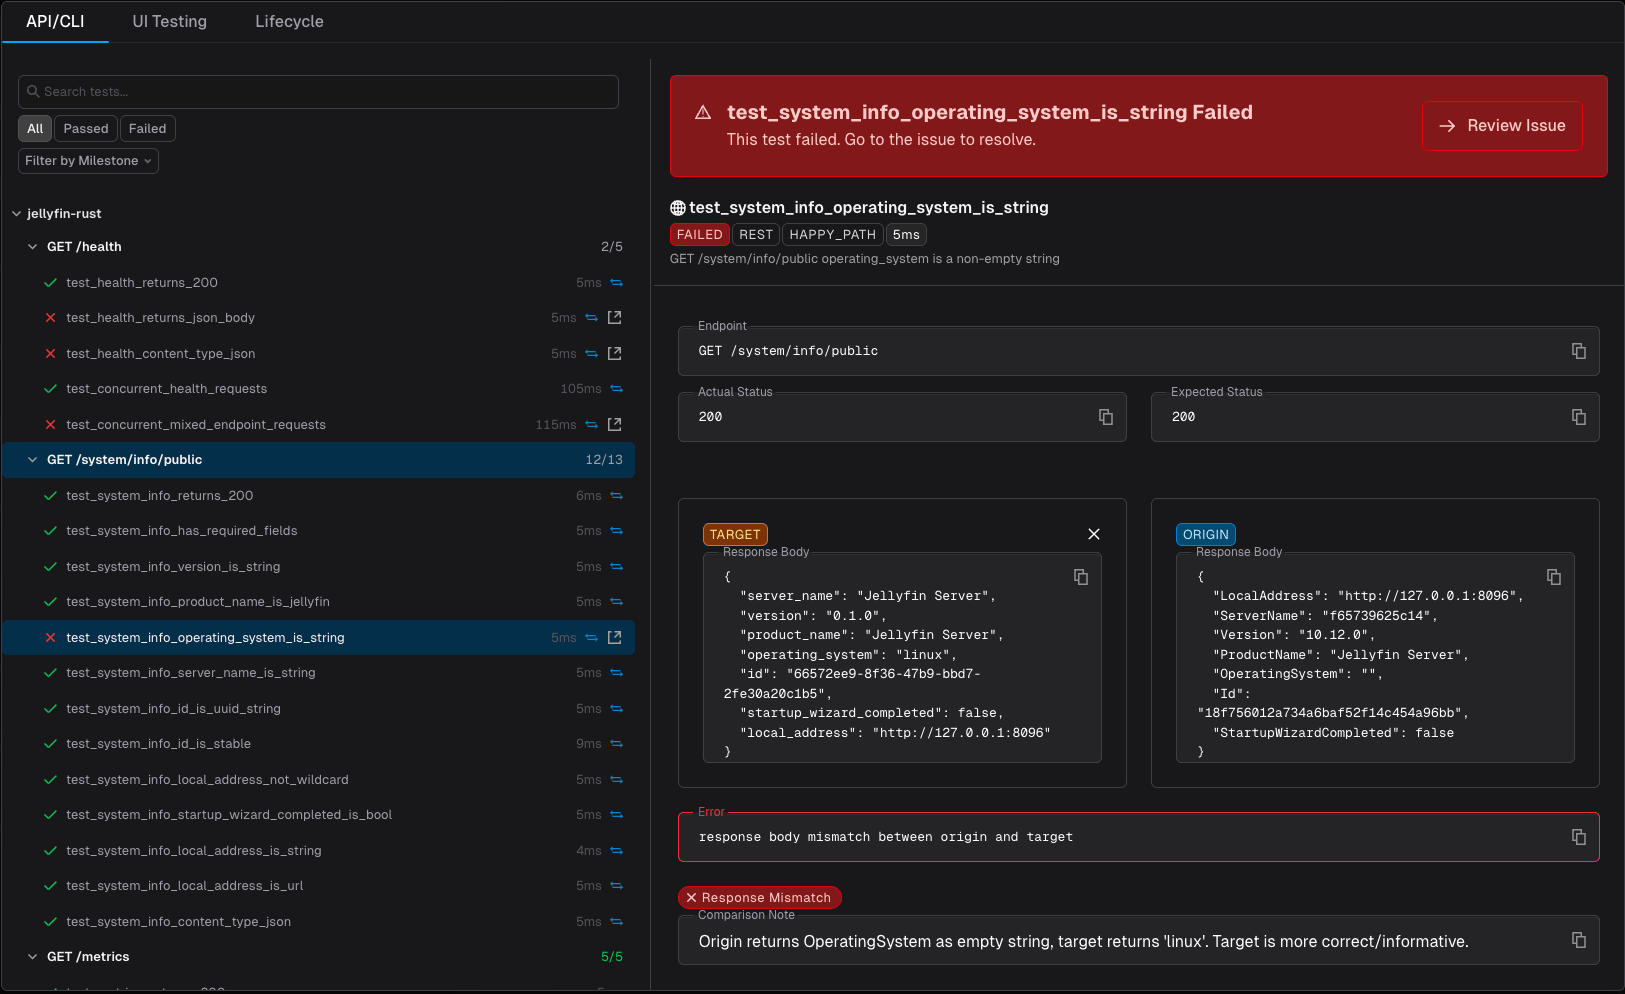
- Error — On a failed test, the specific mismatch that was detected (e.g.,
response body mismatch between origin and target) - Failed test banner — On a failed test, a banner across the top of the panel with a Review Issue button that jumps straight to the auto-created review issue
- Command — The full command invocation (e.g.,
$ checkWinner [...]) - Arguments — The exact argument list passed to both origin and target
- Expected vs Actual Exit Code — With mismatch highlighting
- Target stdout/stderr — Output from the migrated application
- Origin output — Output from the original application (when comparison data is available)
- Match indicators — Output Match / Output Mismatch tags with diff view
checkWinner). CLI tests share the same detail panel component as API tests, so a Comparison Note and failed-test banner appear there too when applicable.
UI Testing Tab
The UI Testing tab groups both kinds of frontend testing under a pair of sub-tabs:- Test — scripted Playwright runs with deterministic pass/fail outcomes
- Comprehensive — agentic browsing sessions with no concept of pass/fail
Test
The Test sub-tab shows Playwright test results — scripted browser tests with deterministic pass/fail outcomes and precise runtime information. These are traditional end-to-end tests that exercise specific user flows and assert expected behavior.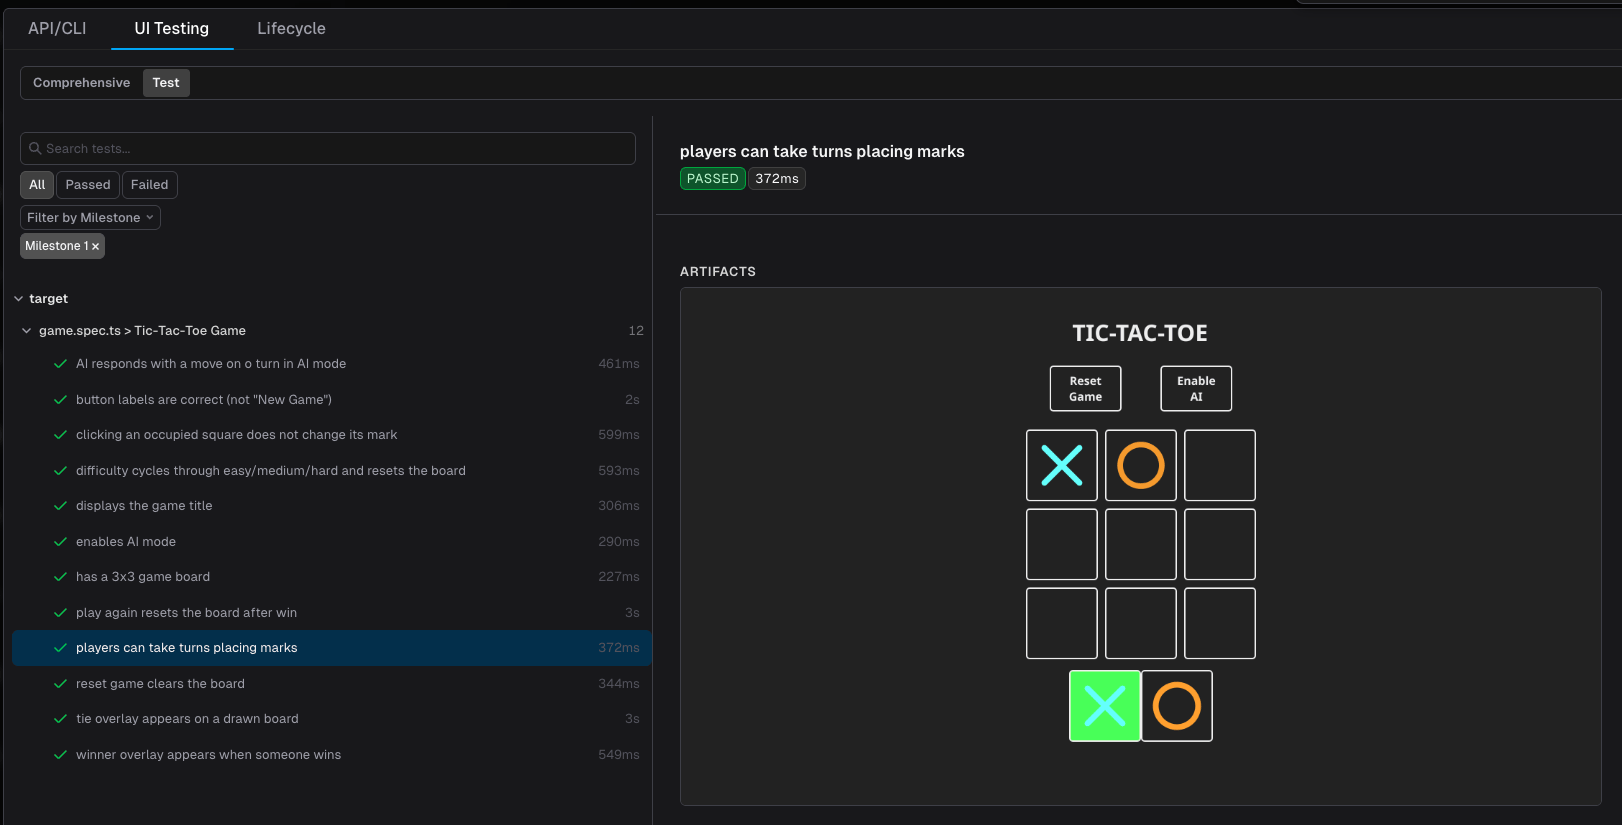
game.spec.ts > Tic-Tac-Toe Game), then by individual test case, with a passed/total count on each group. Each test entry shows:
- Pass/fail status — Green checkmark for passing tests, red indicator for failures
- Runtime — How long each test took to execute (e.g.,
290ms,2s)
- Test name and status — The full test description with a pass/fail badge and duration
- Artifacts — Passing tests show a single screenshot of the final state
- Video recording — Failing tests additionally include a video recording of the full test run for debugging context
Comprehensive
The Comprehensive sub-tab shows agentic browsing sessions — an AI agent freely navigates the application and documents key moments as screenshots and videos. Unlike the Test sub-tab, these sessions are exploratory and semantically meaningful, with no concept of pass or fail. Comprehensive sessions are typically used to increase trust and visibility into what the migration agent actually implemented and validated. They provide a human-reviewable walkthrough of the application’s behavior.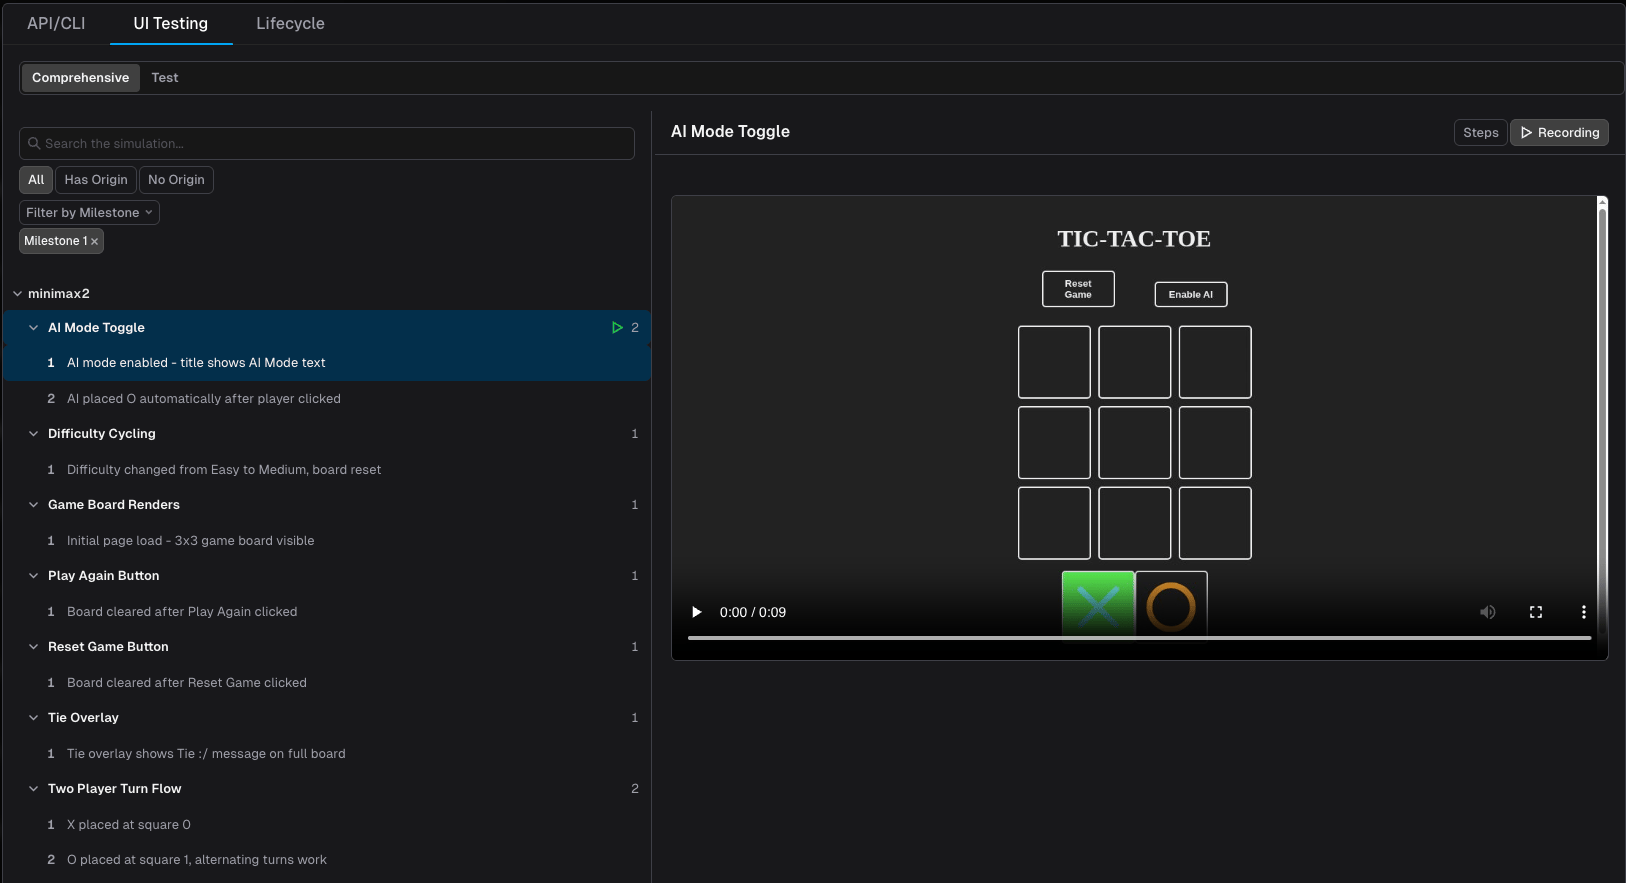
- Step count — Number of documented moments in the session
- Step navigation — Arrow buttons or keyboard arrows to move between steps
- Step label — Description of what the agent observed at each moment (e.g., “AI mode enabled - title shows AI Mode text”)
- Screenshot — A full-page screenshot captured at each documented moment
- Video — When available, a video recording of the agent’s browsing session
Lifecycle Tab
The Lifecycle tab shows the results of the lifecycle scripts — install, build, run, and test — that Morph executes to stand up each application. Use it to confirm the target app actually builds and runs before digging into functional test results; a lifecycle failure here explains a wave of downstream API/CLI or UI test failures.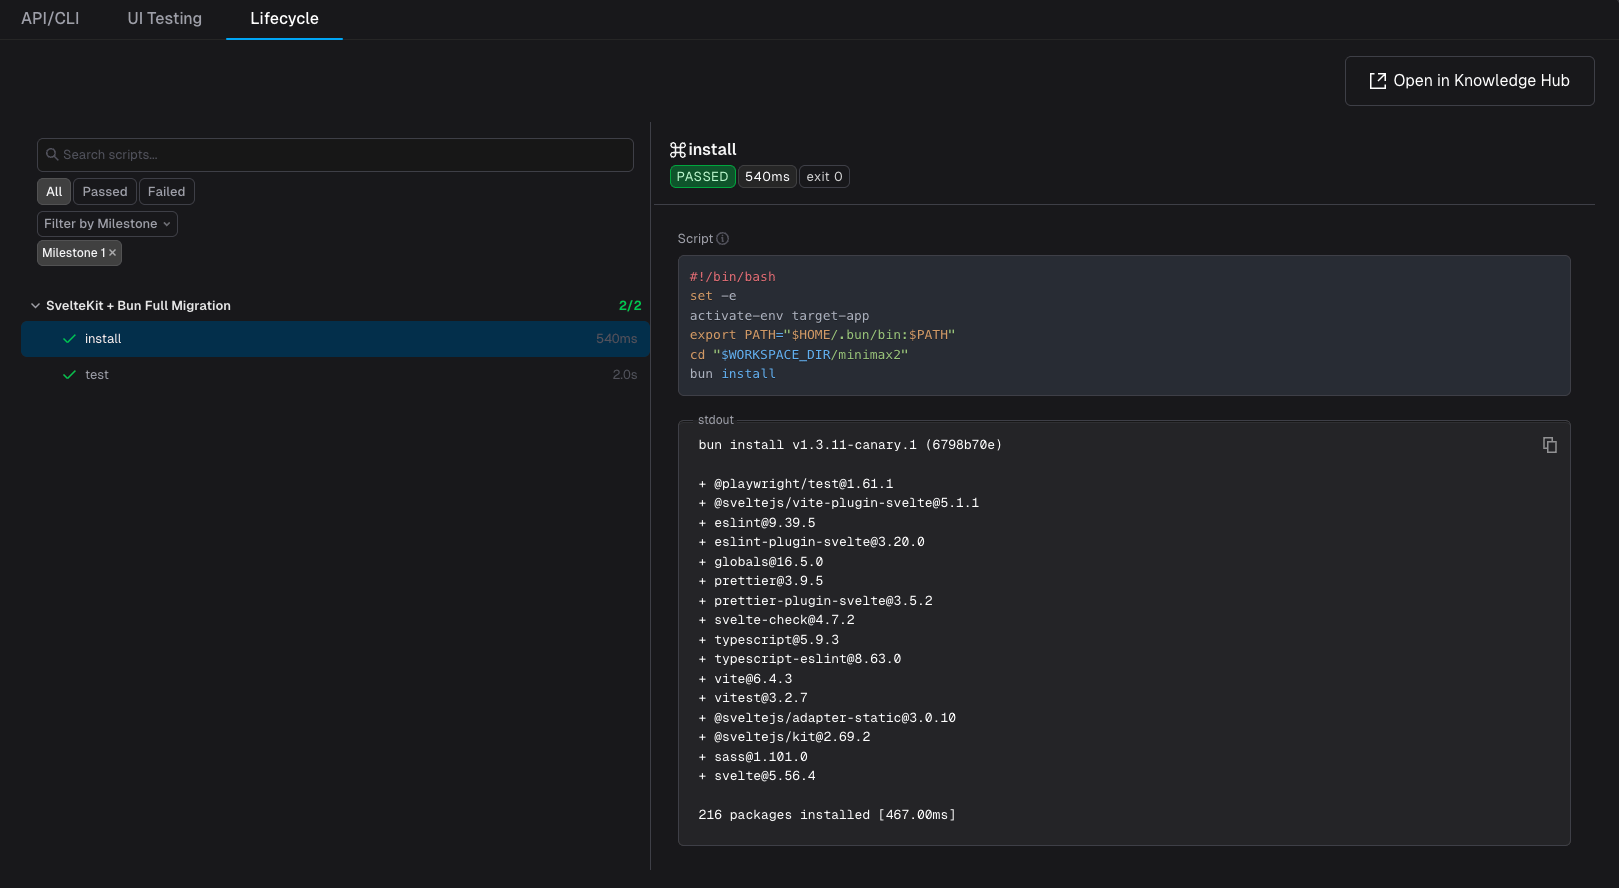
Sidebar Tree
Scripts are grouped by milestone (e.g., “SvelteKit + Bun Full Migration”). Each script entry —install, build, run, test — shows:
- Pass/fail status — Green checkmark for a successful run, red indicator for failure
- Duration — How long the script took to run
Detail Panel
Selecting a script opens the detail panel on the right:- Status, duration, and exit code — At-a-glance pass/fail summary
- Script — The exact shell commands that were run
- stdout — Full output captured from the run
- Open in Knowledge Hub — Jumps to the underlying lifecycle document for that repo in Project Knowledge
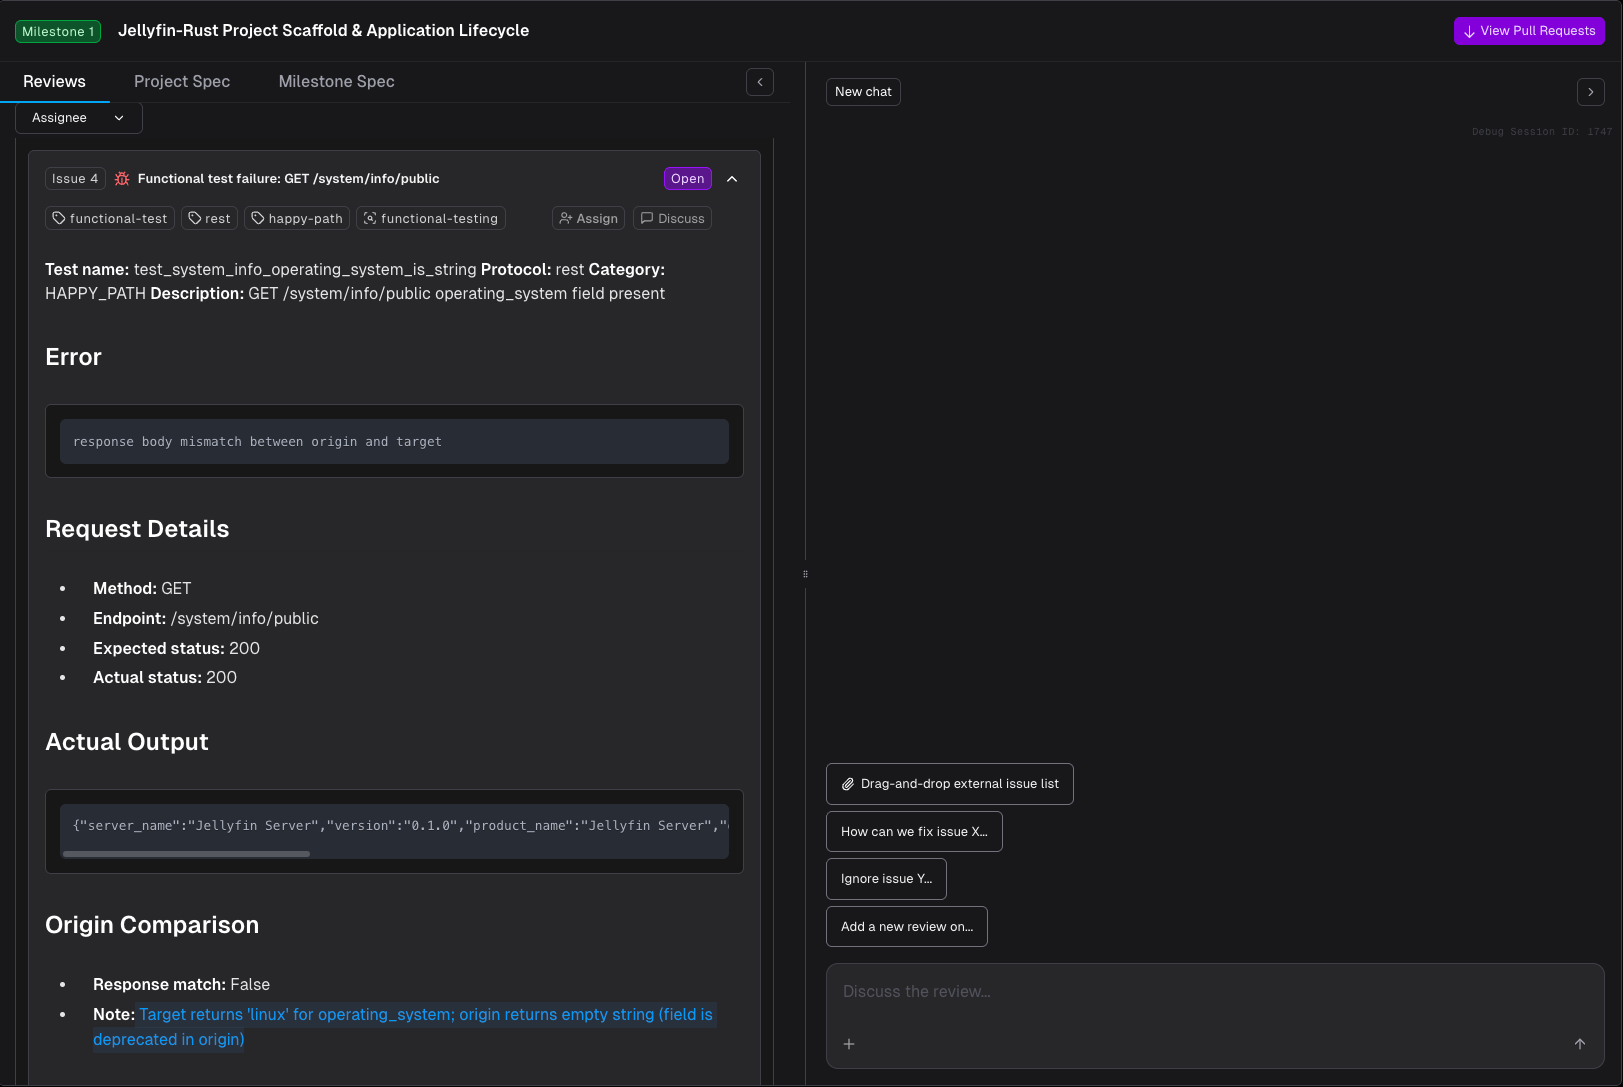
Failed Tests Create Review Issues
Any functional test that fails automatically opens a review issue on the milestone’s Code Review drawer — tagged withfunctional-test, its protocol (e.g. rest), its category (e.g. happy-path), and functional-testing — so failures surface for triage without you having to go looking for them.
The failed test and its review issue are linked in both directions:
- From the Validation Hub — the failed test’s detail panel shows a banner with a Review Issue button that jumps straight to the issue. In the sidebar tree, failed tests show an external-link icon as the same shortcut.
- From the review issue — the issue mirrors the test’s data (request details, actual output, origin comparison) and can be discussed like any other review issue: open Code Review Chat and ask Morph to fix it, or resolve it manually.
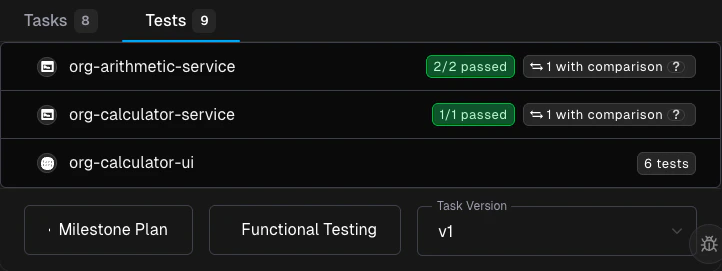
Milestone Test Summary
Each milestone card on the roadmap displays a test summary after execution completes. The summary shows per-repo results:- Backend tests — Repository name with passed/total count and a comparison indicator
- UI tests — Repository name with passed/total count
- Comprehensive sessions — Repository name with session count and step totals
Tips
- Review tests early. As soon as tests are generated, skim them in the milestone test summary. If an entry point is missing, it may indicate the agent couldn’t reach it — check your lifecycle setup configuration.
- Check Lifecycle before API/CLI or UI Testing. If a milestone shows widespread test failures, check the Lifecycle tab first — a broken install/build/run step will fail everything downstream.
- Use the Validation Hub for stakeholder updates. The passed/total ratio and origin comparison counts are intuitive, non-technical measures of migration completeness.
- Combine with rules. If tests reveal a recurring pattern (e.g., missing headers, wrong status codes), create a Rule so Morph handles it in future milestones.
- Filter to failures. On the API/CLI and UI Testing tabs, use the Failed filter to focus your review on the tests that need attention.
- Triage failures from the test itself. A failed test’s Review Issue button (or the sidebar’s external-link icon) jumps straight into Code Review with the failure details pre-loaded — no need to re-describe what broke.
Related Docs
Milestones
The milestone lifecycle, statuses, and task dependencies
Roadmap
High-level view of your migration plan
Reviewing Pull Requests
Best practices for reviewing milestone PRs
Code Review Chat
Triage review issues — including auto-created failed-test issues — with chat
Lifecycle Setup
Configure how your project builds and runs