After a milestone finishes (or fails), this guide walks you through checking the agent’s output, finding and reading transcripts, and diagnosing and resolving failures.Documentation Index
Fetch the complete documentation index at: https://docs.modelcode.ai/llms.txt
Use this file to discover all available pages before exploring further.
Running a Milestone
How to start milestones and watch the agent work
Reviewing Code Changes
The main output of a milestone is a pull request. Once the milestone finishes, click Review Pull Request on the milestone card to open the PR in GitHub. This contains all the code the agent wrote across every task. Review it like any other pull request: look at the diffs, check that the logic makes sense, and verify that the file structure matches your expectations.Reviewing Pull Requests
Best practices for reviewing migration PRs
Finding the Execution History
The execution history is where you go to access transcripts, logs, and details for any execution. Here’s how to get there:- Click the play icon in the left sidebar to open the Executions page
- Select your project from the dropdown at the top
- You’ll see a chronological list of every execution for that project
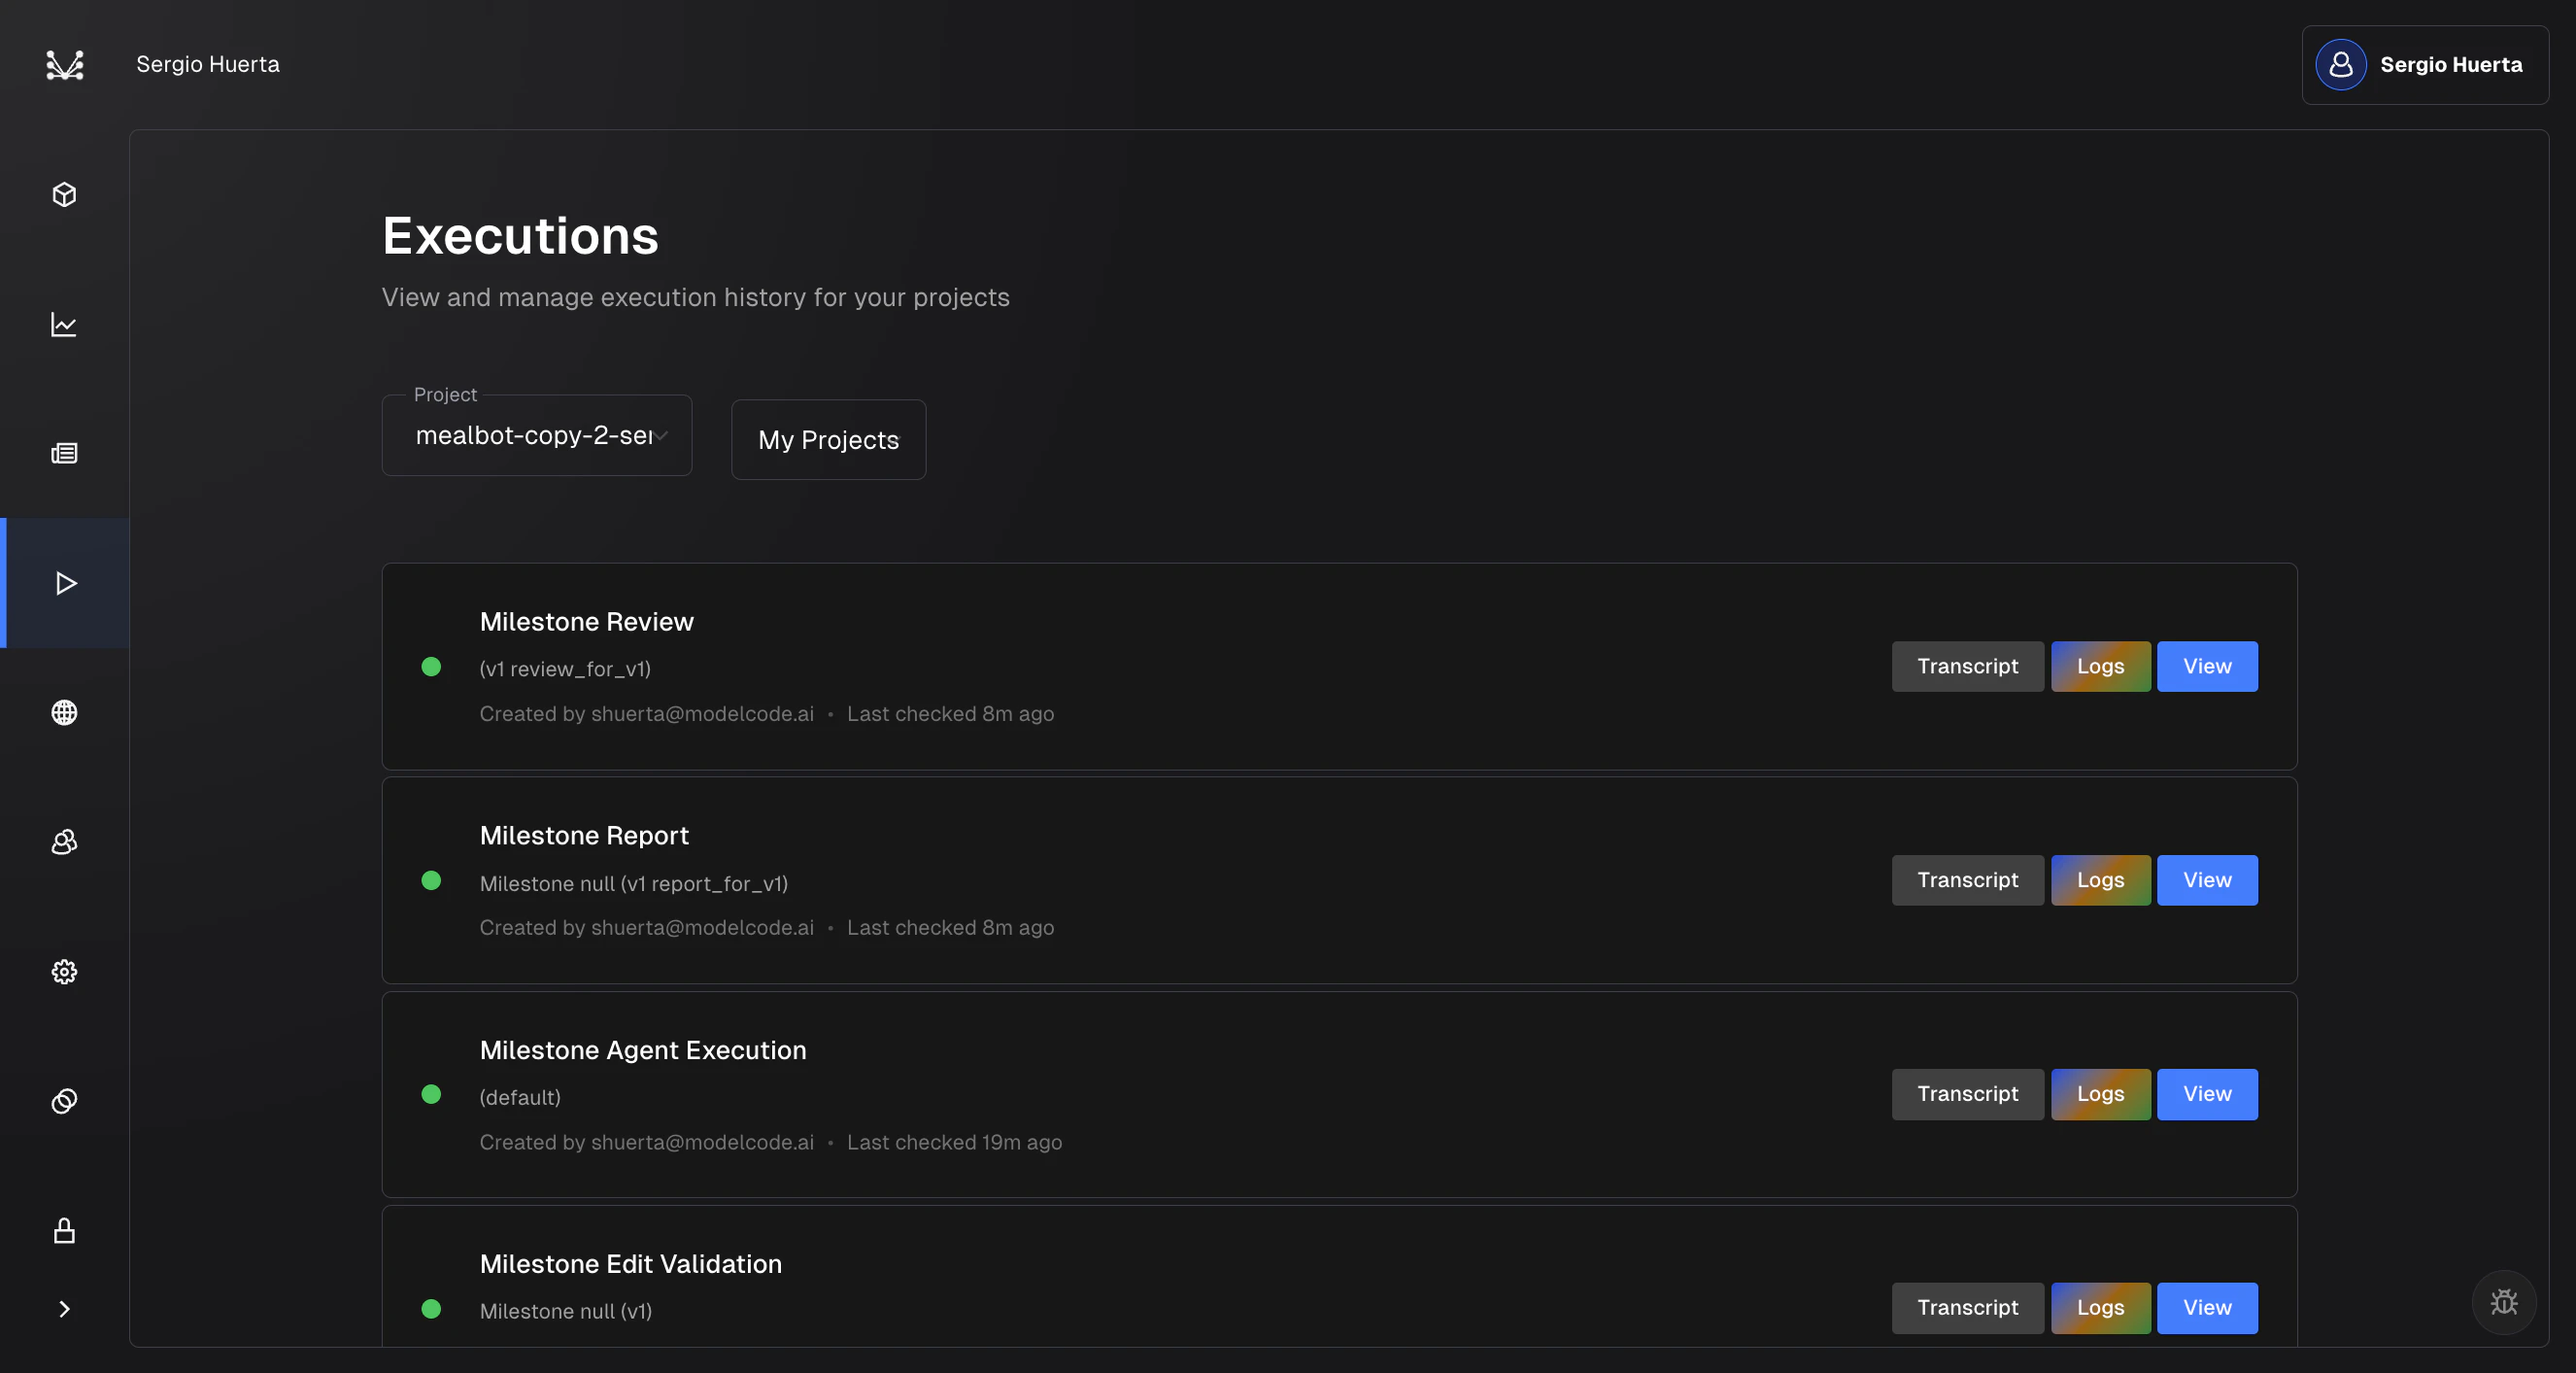
- Transcript: Opens the full step-by-step record of what the agent did
- Logs: Opens server-side infrastructure logs in SigNoz
- View: Takes you back to the project roadmap for that milestone
Reading a Transcript
Transcripts are the most useful tool for understanding what the agent did and why. You don’t need to read them for every task, but open one when:- A task failed and the error message alone doesn’t explain why
- The output doesn’t look right and you want to see how the agent approached the problem
- You want to verify that the agent understood your instructions correctly before merging
How to Open a Transcript
From the execution history:- Go to the Executions page (play icon in the left sidebar)
- Find the execution you want to inspect
- Click the Transcript button on that row
- On the roadmap, click on any task to open its drawer
- Click the Transcript tag in the drawer
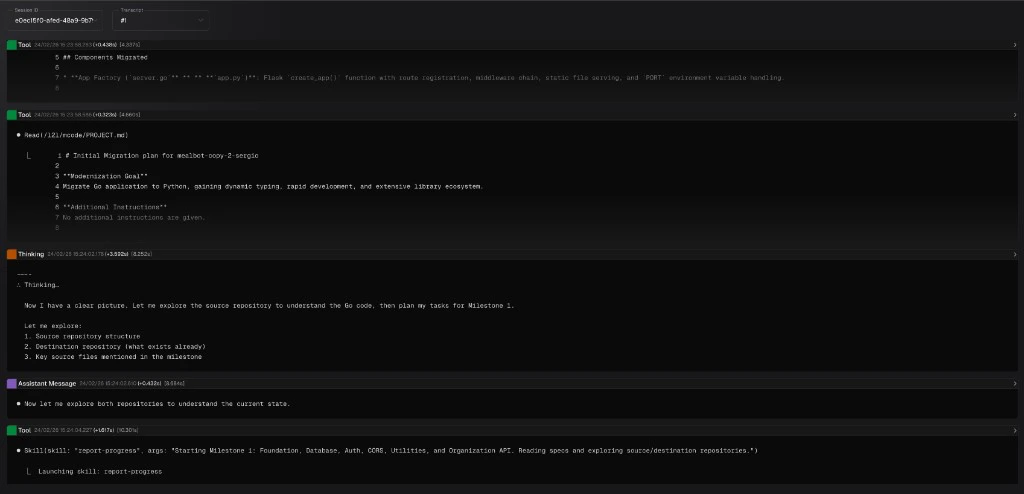
Navigating the Transcript
| Type | Color | What it contains |
|---|---|---|
| User Message | Blue | The instructions sent to the agent, including the task prompt and context |
| Assistant Message | Purple | The agent’s responses, plans, and reasoning |
| Tool | Green | Tool calls and their results (file edits, shell commands, searches, builds) |
| Thinking | Orange | The agent’s internal reasoning before acting |
Timestamps
Each message header shows when it happened and how long it took. For example:Tool 24/02/26 15:24:13.648 (+1.372s) [19.722s]The
(+1.372s) is the gap since the previous message, and [19.722s] is the total time since the execution started. You don’t need to study these closely, but they’re helpful for spotting problems: if you see a gap like (+68s) between messages, the agent was likely stuck waiting on something (a slow build, a timeout, etc.).
Searching a Transcript
Transcripts can be long. Use Cmd+F (Mac) or Ctrl+F (Windows) to search. This works like a normal find-in-page, but it also auto-expands collapsed messages that contain matches, so you won’t miss anything. Some useful things to search for:- An error message you saw in the task drawer, to find where it originated
- A file name to see every time the agent touched that file
- “error” or “failed” to jump straight to problems
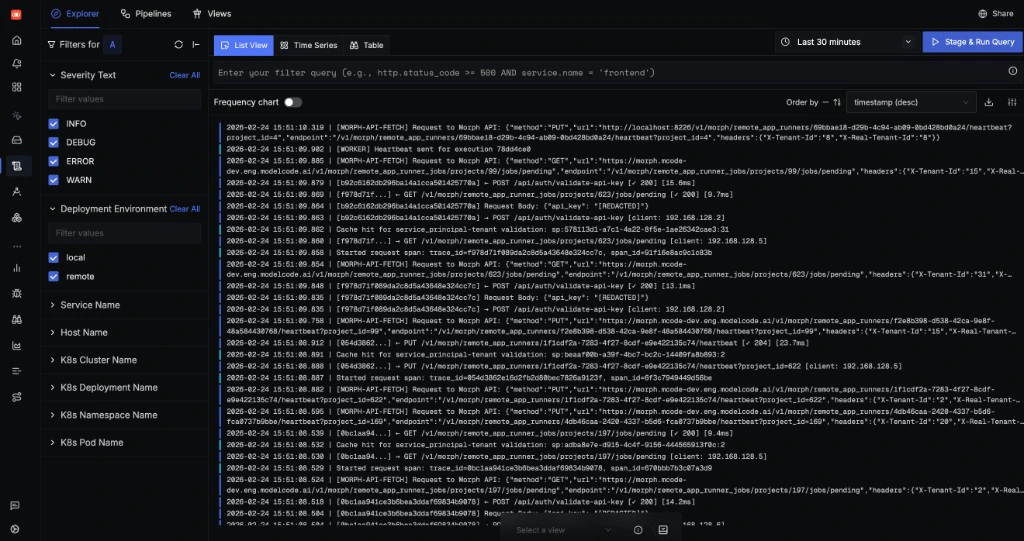
Viewing Logs
If the transcript doesn’t reveal the issue, the server-side logs can help. These are lower-level infrastructure logs that show what happened at the system level: build output, API requests, worker processes.How to Open Logs
- Go to the Executions page (play icon in the left sidebar)
- Find the execution you want to inspect
- Click the Logs button on that row
- You see errors like “sandbox failed” or “infrastructure error” in the task drawer
- The transcript looks normal but the task still failed
- You suspect a system-level problem (network, sandbox, build environment)
Handling Failures
Tasks can fail for various reasons: build errors, test failures, agent errors, or infrastructure issues. Here’s how to work through them.Step 1: Read the Error Message
When a task fails, the error is shown in two places:- Task drawer: Click the failed task on the roadmap. A red alert shows “Task Failed” with the error message.
- Execution history: The execution row shows a red status dot. Click to expand and see error details.
Step 2: Check the Transcript
If the error message isn’t enough, open the transcript:- Open the transcript for the failed execution (see How to Open a Transcript above)
- Start at the bottom. The last few messages show what the agent was doing right before it failed. Look at the green Tool messages for the actual commands or file writes that went wrong.
- Check the orange Thinking messages nearby. These show the agent’s reasoning. If it misunderstood your instructions or made a bad assumption, you’ll see it here.
- Search for the error. If you saw an error message in the task drawer (e.g., “ModuleNotFoundError: No module named ‘flask’”), use Cmd+F to search for it in the transcript. This takes you straight to where the error originated.
- Look for long pauses. A gap like
(+68s)between messages usually means the agent was waiting on a slow build or hit a timeout.
Step 3: Check the Logs (if needed)
If the transcript looks normal but the task still failed, open the logs (see How to Open Logs above). Look for infrastructure-level problems like sandbox failures or network issues.Common Failure Patterns
| Pattern | What’s happening | What to try |
|---|---|---|
| Build failure after code changes | Generated code has syntax or import errors | Retry. The agent often self-corrects. If persistent, check the milestone description for unclear instructions. |
| Test failures | Generated tests don’t match expected behavior | Review the test expectations. Consider adding a Rule to clarify testing conventions. |
| Task timeout | The task took too long to complete | The scope may be too large. Consider breaking the milestone into smaller pieces. |
| Infrastructure error | Sandbox or environment issue | Retry. These are usually transient. |
| Dependency failure | A preceding task failed, causing this one to be skipped | Fix the root cause (the upstream task) first, then retry. |
| Agent execution failed | The milestone agent itself crashed | Click Retry on the error alert to restart the agent. |
Retrying
After understanding the failure:- Simple retry: Click Retry Execute in the task drawer. This resets failed tasks and creates a new execution. Tasks that already completed are not re-run.
- Retry with changes: Edit the milestone description to clarify instructions, save, then retry. This gives the agent better context.
- Retry PR generation: If tasks succeeded but PR creation failed, click Retry PR on the milestone.
- Retry agent: If the milestone agent itself failed, click Retry on the error alert to restart the entire agent process.
Canceling a Running Execution
If an execution is taking too long or you realize the instructions were wrong:- Go to the Executions page (play icon in the left sidebar)
- Find the running execution
- Cancel it
Tip: If the same failure keeps happening, create a Rule to encode the fix. Rules persist across milestones and prevent recurring issues.
Related Docs
Running a Milestone
How to start milestones and watch the agent work
Milestones & Tasks
The milestone lifecycle and task types
Reviewing Pull Requests
How to review and merge the generated PR
Creating Rules
Encode preferences for better results